Analyze
Export my data
Read article
The Utilization feature is a really useful tool when you want to monitor and measure the actual working hours of an asset.
Utilization data is logged passively by one of the built-in sensors from the device, e.g. the accelerometer, the light sensor or the thermometer.
When the utilization is enabled, the specific sensor constantly registers if the device is in use or not.
This feature can be used to get an overview of the running hours of your equipment, to predict maintenance based on service intervals, or to detect unauthorized usage (e.g. outside normal working hours).
The Utilization feature is included in the Trusted Vision subscription.
If you start using the Utilization feature with a Trusted Standard subscription, your subscription will automatically change to Vision.
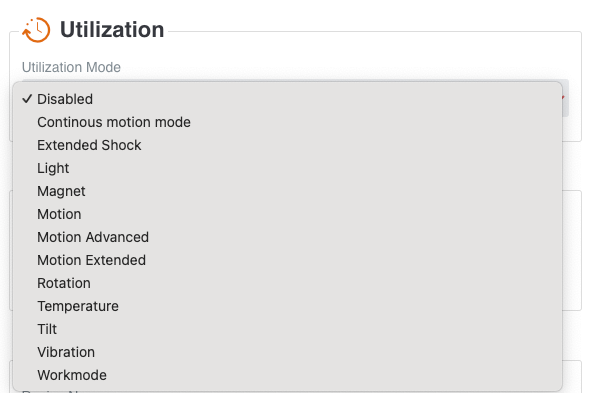
Each Utilization mode offers different configuration options, such as:
At the next scheduled or triggered transmission, the device will start logging Utilization data based on the selected Utilization mode and settings.
To correctly register Utilization data, the data tracker must perform at least one transmission or log per day. This is required to calculate Utilization for the last 24 hours.
If your device transmits less frequently than daily:
To see Utilization data for a single device:
The Utilization graph view consists of three separate graphs:
This graph shows the minutes where the device was registered as “in use”, indicated by green blocks.
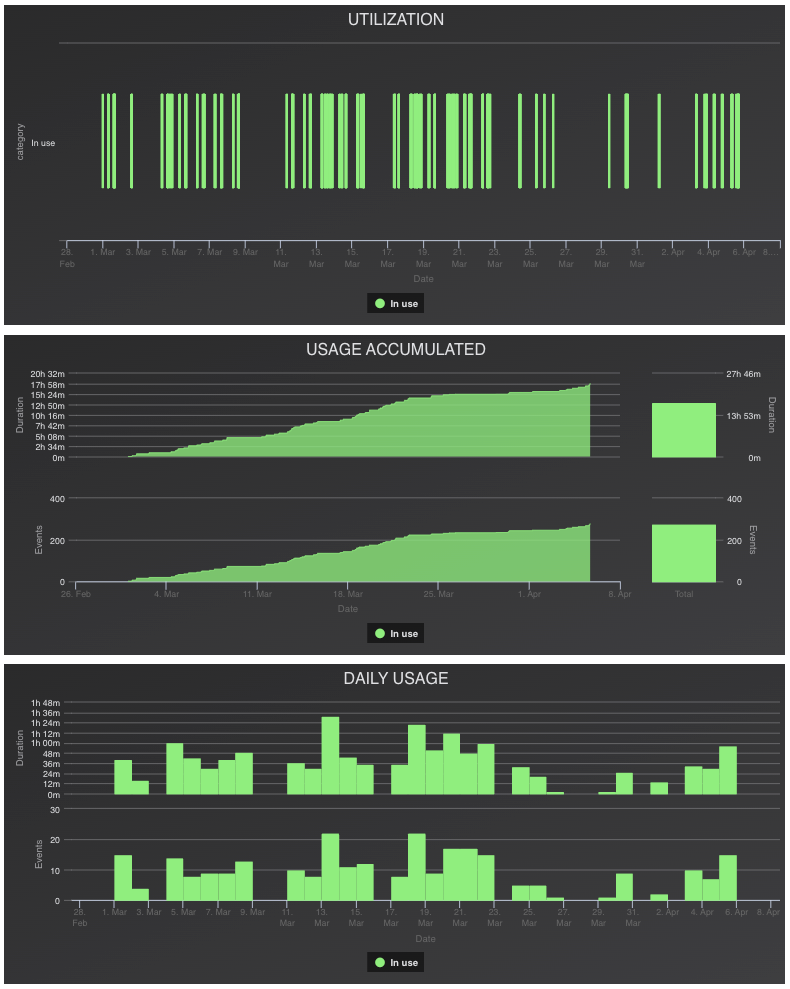
This graph displays:
On the right side, you can see the total Utilization for the selected time period.
The Daily usage graph shows:
Total hours, minutes, and seconds of Utilization per day
Number of events per day
Vertical axis: Utilization minutes
Horizontal axis: Date
Mouse over a block to see daily totals
Drag and drop to zoom in on specific periods
All Utilization data can be exported from the bottom of the page.
You are able to see utilization data for several devices at once.
Go to a group and click on the Daily utilization tile to see utilization data for a group of devices.
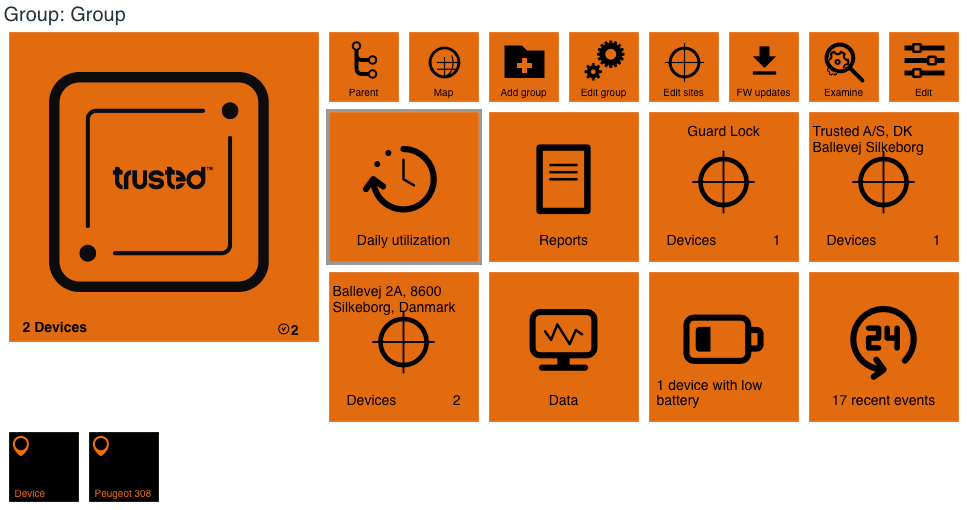
The green color indicates when the device has been in use. The vertical axis shows the serial numbers of the devices and the horizontal axis shows a timeline for the day.
Mouseover a green area to see the exact start and stop time of a device.
To zoom, select a point on the graph with the arrow and drag it to see a more specific date or time frame of the usage.
Click a device name in bold to go the device. In italic, you see the subgroups of the devices.
Click on Export to export the utilization data of the group into an Excel document.

Other articles in this category that might help
Can't find what you're looking for? Our support team is here to help.
Contact Support